By 2040, the EU market for digital agriculture technologies could be worth between about €52 billion and €77 billion a year, depending on the scenario. Yet even in the highest-uptake scenario, less than a sixth of potential devices and subscriptions would be in use. Survey data tell us where digital agriculture stands today. Policymakers, however, have to plan for where it will be in ten or fifteen years. The Projections page of the 4Growth Visualisation Platform answers that need with market forecasts for digital agriculture technologies across the EU up to 2040, under four contrasting futures. This post looks at what those futures actually project for 2040, what the differences between them mean, and how policymakers can turn the results into better-targeted policy.
Most evidence on digitalisation in farming is a snapshot: it cannot say how quickly uptake will grow, or whether today’s gaps between countries will narrow or widen. The Projections page fills that gap, estimating the market year by year from 2020 to 2040 under a Baseline and three alternative scenarios, to be read as a range of plausible outcomes rather than a prediction.
The Baseline scenario assumes that the trends seen in historical data continue, with no major structural change in the market. For policymakers it is the natural reference point: the “business as usual” path against which any intervention can be judged.
The page presents six indicators side by side: addressable market, the share of total market potential that can realistically be reached; penetration, the percentage of that market already reached; plus shipments, installed base, prices and revenues. The addressable market is counted in devices and subscriptions rather than farms or farmers, and the all-technology totals combine very different products, from animal tags and soil sensors to robots and software subscriptions, so the results for individual technologies provide a clearer picture.
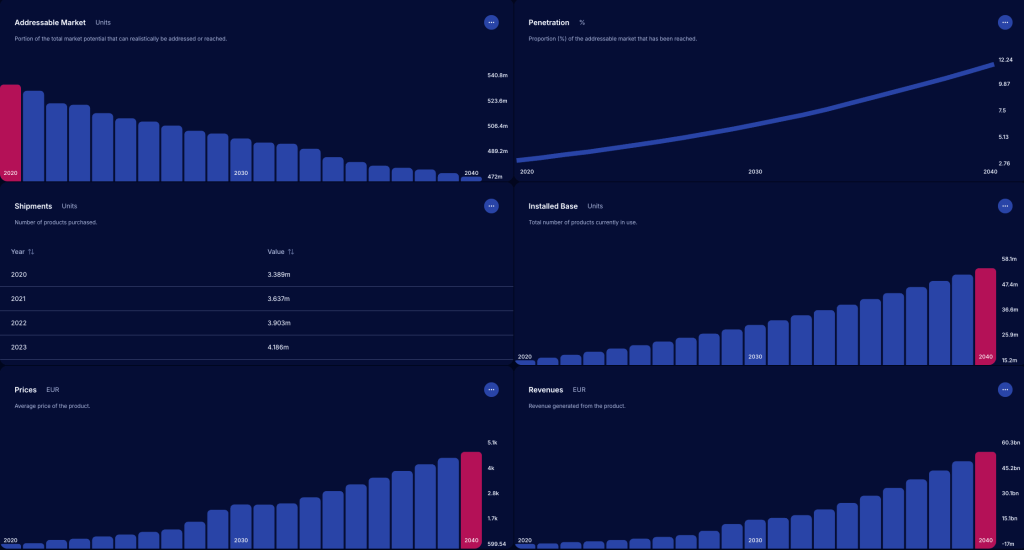
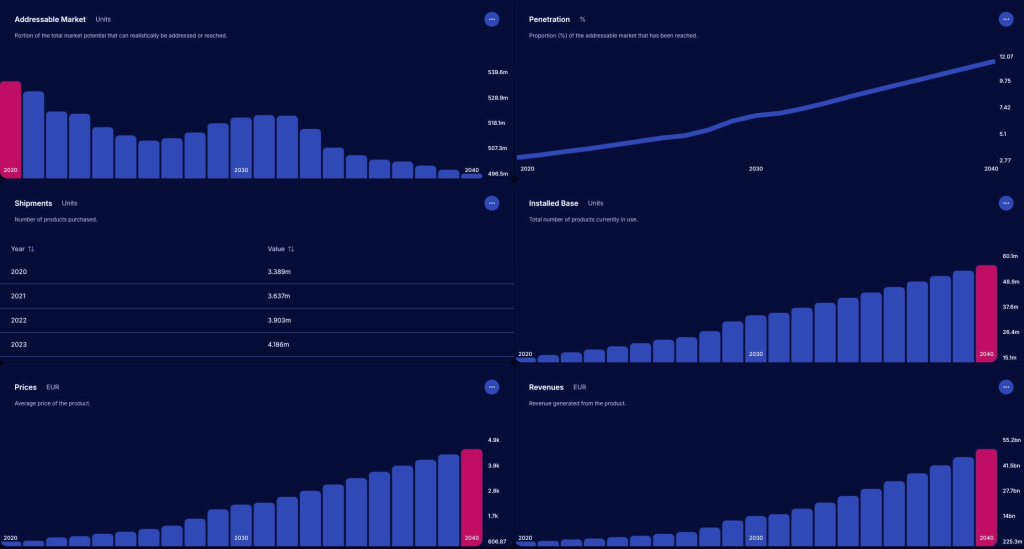
Taking an overall view of the market for all digital agriculture technologies; under the Baseline scenario, annual shipments of digital agriculture technologies (across EU Member States) grow from about 3.4 million units in 2020 to 6.7 million in 2030, and to 11.8 million by 2040, roughly three and a half times the 2020 level. Penetration rises over the same period, but most of the addressable market remains unreached. For policymakers, that gap between growing sales and a still-modest share of the addressable market is where targeted support can make the biggest difference.
By 2040 the Baseline scenario projects an installed base of around 56 million digital products in use and annual revenues of about €57.5 billion. Yet penetration only reaches about 12% of the addressable market. In other words, even on current trends, close to nine in ten potential devices and subscriptions would still not be in use in 2040. The market grows mainly in value, through rising average prices, rather than in reach.
The real value of the page for policy work lies in its scenarios. Alongside the Baseline, users can select three alternative futures developed through 4Growth’s foresight work. Reimagining Progress describes a Europe with a strong focus on environmental sustainability, digital innovation and knowledge sharing. Fractured Continent describes fragmentation, with rising inequality, disjointed digital policies and socio-political polarisation. Corporate Epoch describes industrialisation alongside severe climate degradation, resource scarcity and digital technologies concentrated in the hands of multinational corporations.
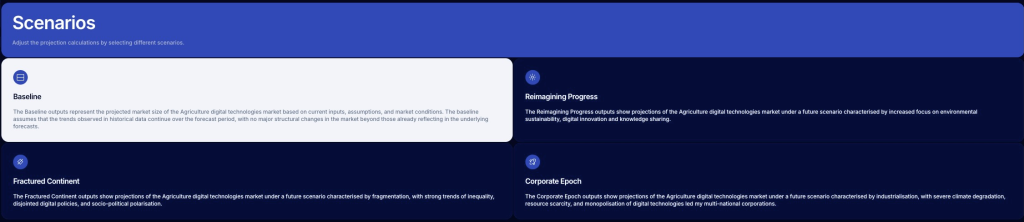
Switching between scenarios shows how sensitive each indicator is to the wider policy and economic environment. A measure that performs well under the Baseline but delivers little under Fractured Continent may need stronger coordination across Member States to work. Equally, a large gap between Reimagining Progress and the Baseline shows how much the wider context matters. Many of the conditions behind each scenario sit outside policymakers’ direct control, so the scenarios are best used to test how robust a measure is across different futures.
The table below compares the end-point of each scenario across the main indicators. The four futures share the same historical starting point, so every difference in 2040 comes from the scenario assumptions, which makes them a direct read-out of how much the wider policy and economic context matters.
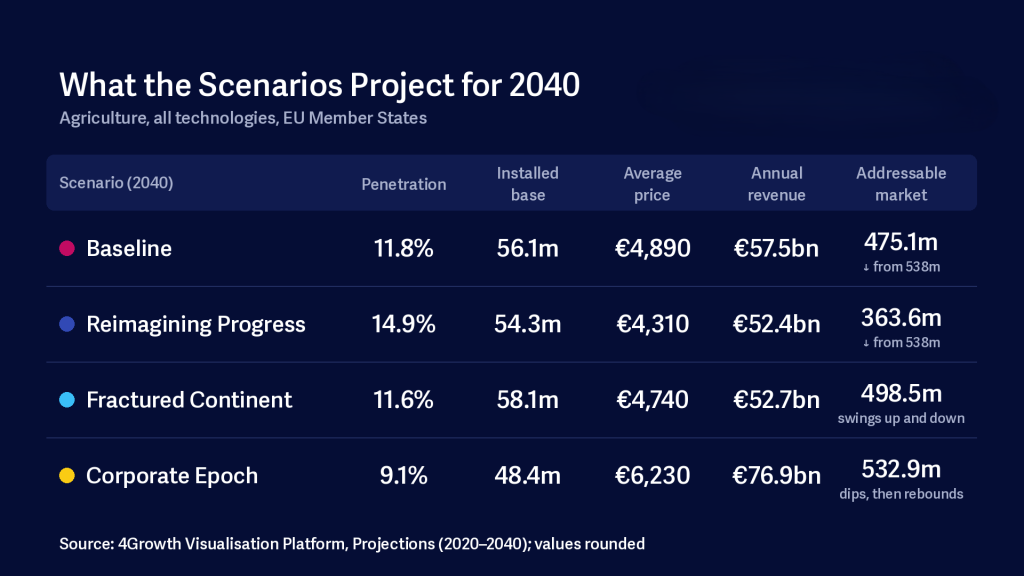
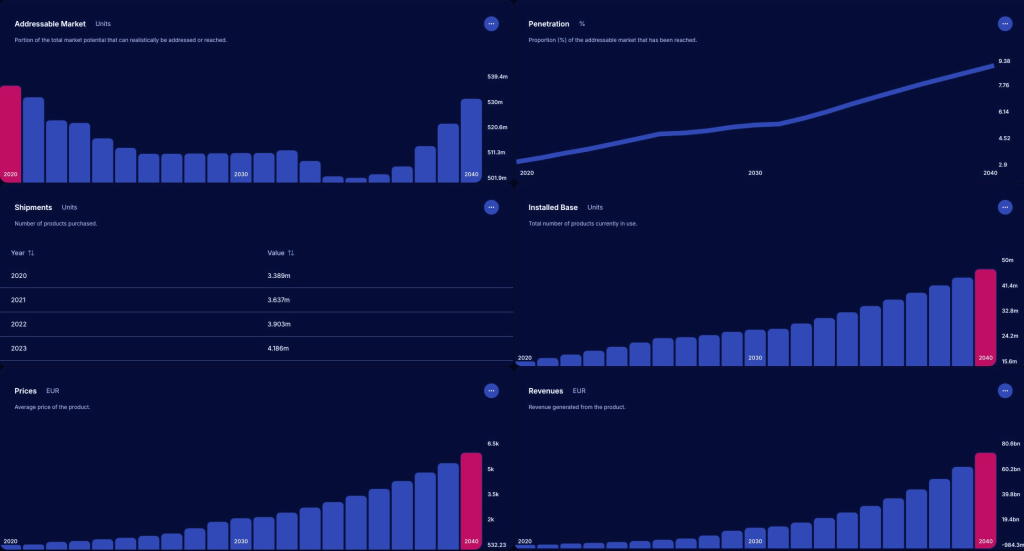
Three results stand out. First, reach and value move in opposite directions: the scenario with the highest revenues (Corporate Epoch, about €77 billion) has the lowest penetration (about 9%), while the scenario with the highest penetration (Reimagining Progress, about 15%) has the lowest revenues. Second, the size of the opportunity itself changes: the addressable market ranges from about 364 million to 533 million units depending on the future. Third, no scenario closes the adoption gap: even in the highest-uptake scenario, around 85% of the addressable market is not reached by 2040.
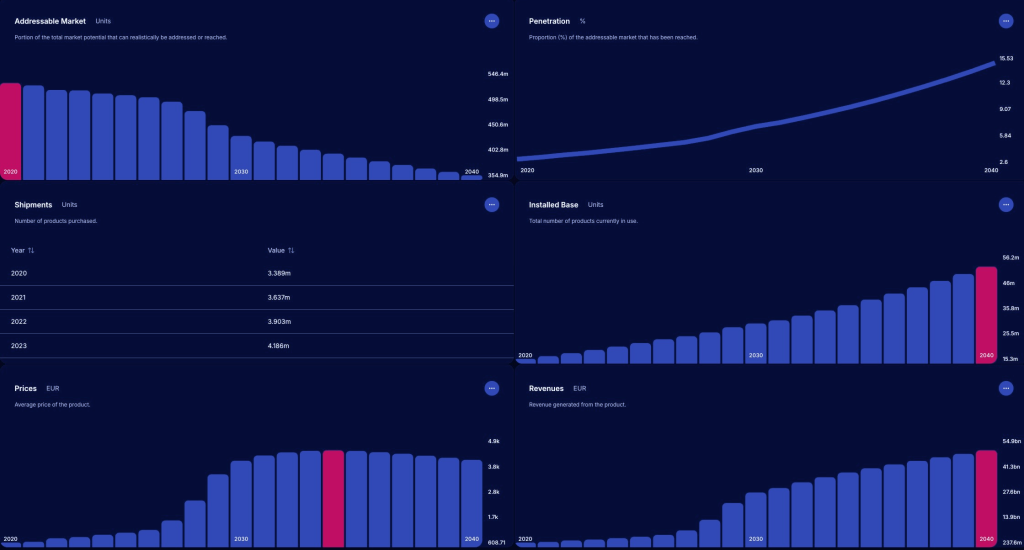
This scenario delivers the highest penetration, about 16% by 2040. Prices level off in the early 2030s and then fall, and revenues end below the Baseline. The addressable market also shrinks sharply, by about a third, and its installed base is in fact slightly below the Baseline. The higher penetration therefore comes from a smaller addressable market being more fully served, not from more products in use. For policymakers, the lesson is that an emphasis on sustainability, innovation and knowledge sharing value pays off in a higher share of the addressable market and lower prices, rather than in market value. If this is the future policy is steering towards, success could be measured by the share of the addressable market in use, not by the size of the market.
At first glance this scenario looks reassuring. It has the largest installed base of any scenario (about 58 million units) and penetration in line with the Baseline. But the addressable market swings up and down over the period, and revenues end around €5 billion below the Baseline. Most importantly, a fragmented Europe is about who benefits, and EU-wide totals cannot show that. Policymakers may want to treat this scenario as a prompt to check country-level results with the filters, and to consider measures that help hold the single market together, such as common data and interoperability standards, cohesion-oriented support for lagging regions, and stable, multi-annual funding that gives farmers and suppliers the confidence to invest.
This scenario produces the most valuable market, with revenues of about €77 billion in 2040, a third above the Baseline. It also has the highest average prices (about €6,200), the smallest installed base (about 48 million) and the lowest penetration (about 9%). At the same time, it has the highest annual shipments of any scenario (about 12.3 million in 2040), reflecting the shorter device lifetimes assumed in this scenario, so users replace products more often. The market grows, a smaller share of the addressable market is reached. For policymakers, this offers the clearest warning against using market size as a proxy for successful digitalisation. Relevant policy levers could include competition and data governance, such as data access and portability, interoperability, and affordability support targeted at small and medium-sized farms.
Taken together, the scenarios suggest four practical ways for policymakers to use the Projections page in policy development:
Track reach and value separately. Revenue and penetration tell different stories, and in these projections they often point in opposite directions. Targets and monitoring frameworks, for example in CAP Strategic Plans, could include indicators of reach, such as the share of farms using a technology, alongside market growth.
Look for no-regret measures. Low penetration appears in every scenario, so measures that lower barriers to adoption, such as advisory services, skills, demonstration farms and support for first-time adopters, are likely to be worthwhile whichever future unfolds.
Plan with ranges, not single numbers. Depending on the scenario, penetration in 2040 falls between about 9% and 15%. Expressing targets and budget assumptions as ranges can make policy more robust to uncertainty than relying on one forecast.
Watch for early signals. Each scenario has a distinctive signature. Sharply rising prices combined with stalling penetration point towards Corporate Epoch, while volatile country-level adoption points towards Fractured Continent. Comparing real-world data with these trajectories over time can show which future is emerging, and when policy needs to adjust.
Europe-wide totals are only the start. The Filters panel narrows the projections by technology and country, and the Sandbox tab lets users build their own visualisations. Our policymakers walkthrough video shows how. The filters cover technology use from farm management information systems to variable rate technologies. These follow the market forecasting categories, so some labels differ from the survey categories used in our practitioners blog: guidance and controlled traffic farming, for example, broadly corresponds to guidance and controlled vehicle technologies.
The 4Growth Projections page turns market forecasting into evidence policymakers can act on. On current trends, the EU market for digital agriculture technologies keeps growing to 2040, but mostly in value rather than reach. The scenarios show that the policy context shapes who benefits as much as how big the market becomes. A sustainability- and knowledge-driven Europe reaches the largest share of its addressable market at lower prices, a corporate-dominated Europe builds the most valuable market with the fewest technologies in use, and a fragmented Europe hides its weaknesses behind healthy averages. In every future, most of the addressable market remains untapped, which makes support for adoption a priority whichever path Europe takes.
Used alongside the platform’s survey analysis, which shows where adoption stands today, the projections help policymakers move from describing the present to planning for the future.
Explore the projections for your country on the 4Growth Visualisation Platform: https://visualisation.4growth-project.eu/projections
Sign up to stay informed of news, key outputs and upcoming events!