You believe farms and forests are waiting for your technology. The 4Growth market size estimates for ten technology categories are a good starting point. They help you check your agri-tech market assumptions and make a convincing case to investors.
But market size is only part of the picture. Your technology may take several years to reach the market, and that market must stay viable for years after that. So ask a harder question: will today’s assumptions still hold in a volatile world? Stress-testing those assumptions is how you manage risk.
Market size alone does not show whether you can win customers. Here is how to test for that.
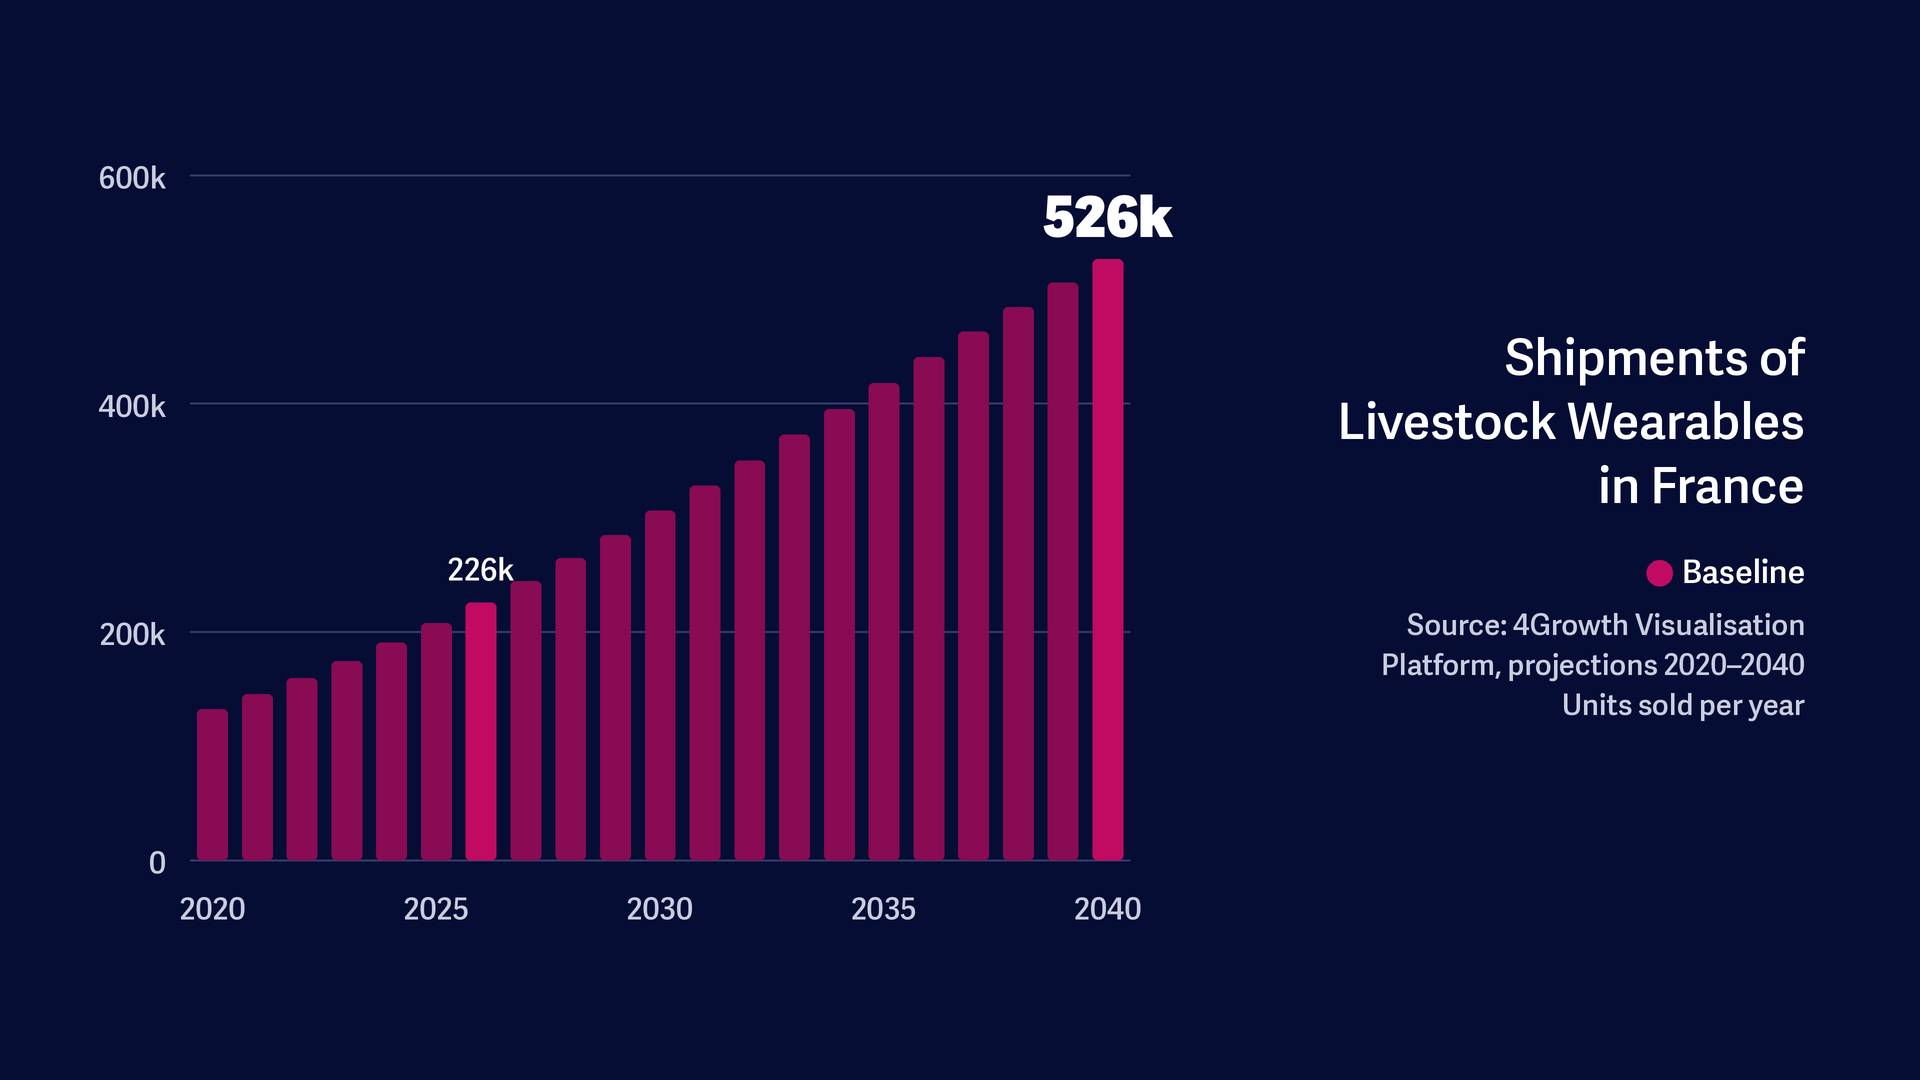
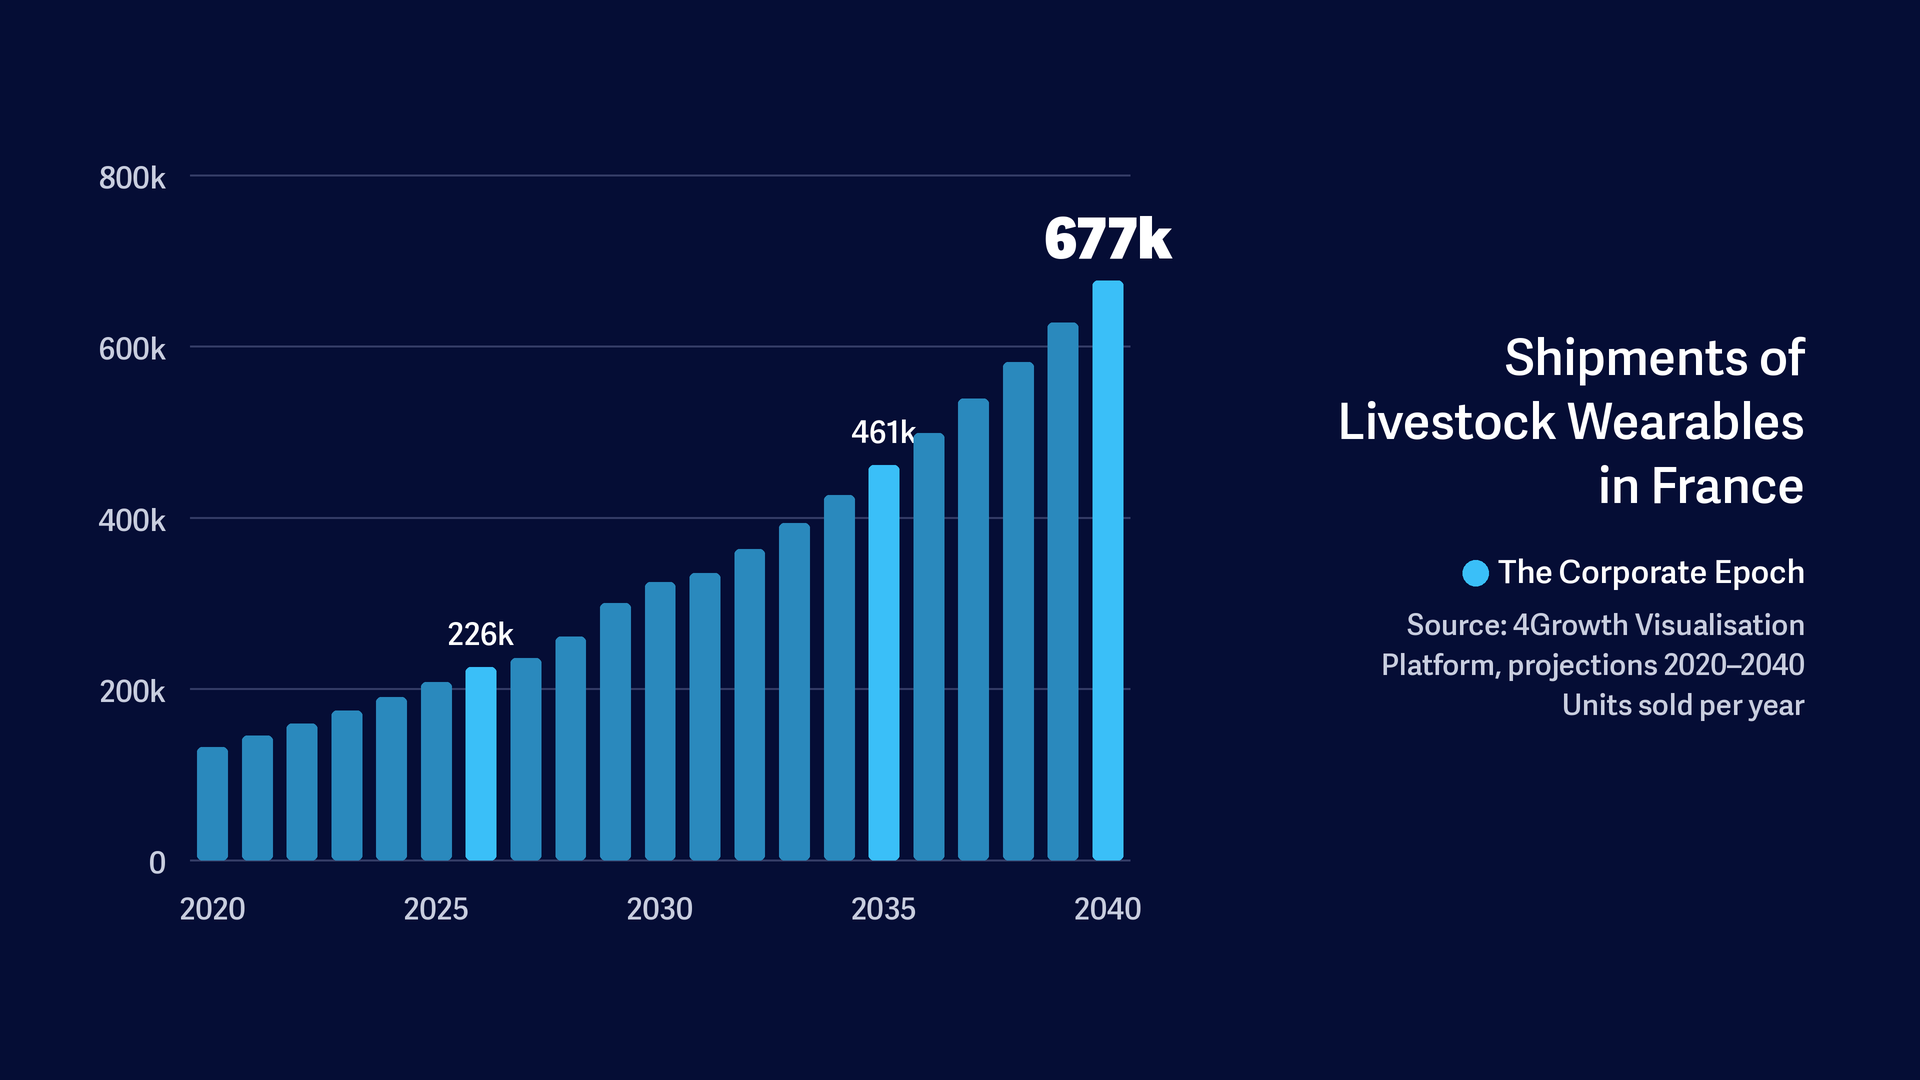
Consider a start-up testing a livestock wearable sensor in France. About 620,000 livestock wearables are installed today, and about 225,000 units are expected to be sold in 2026.
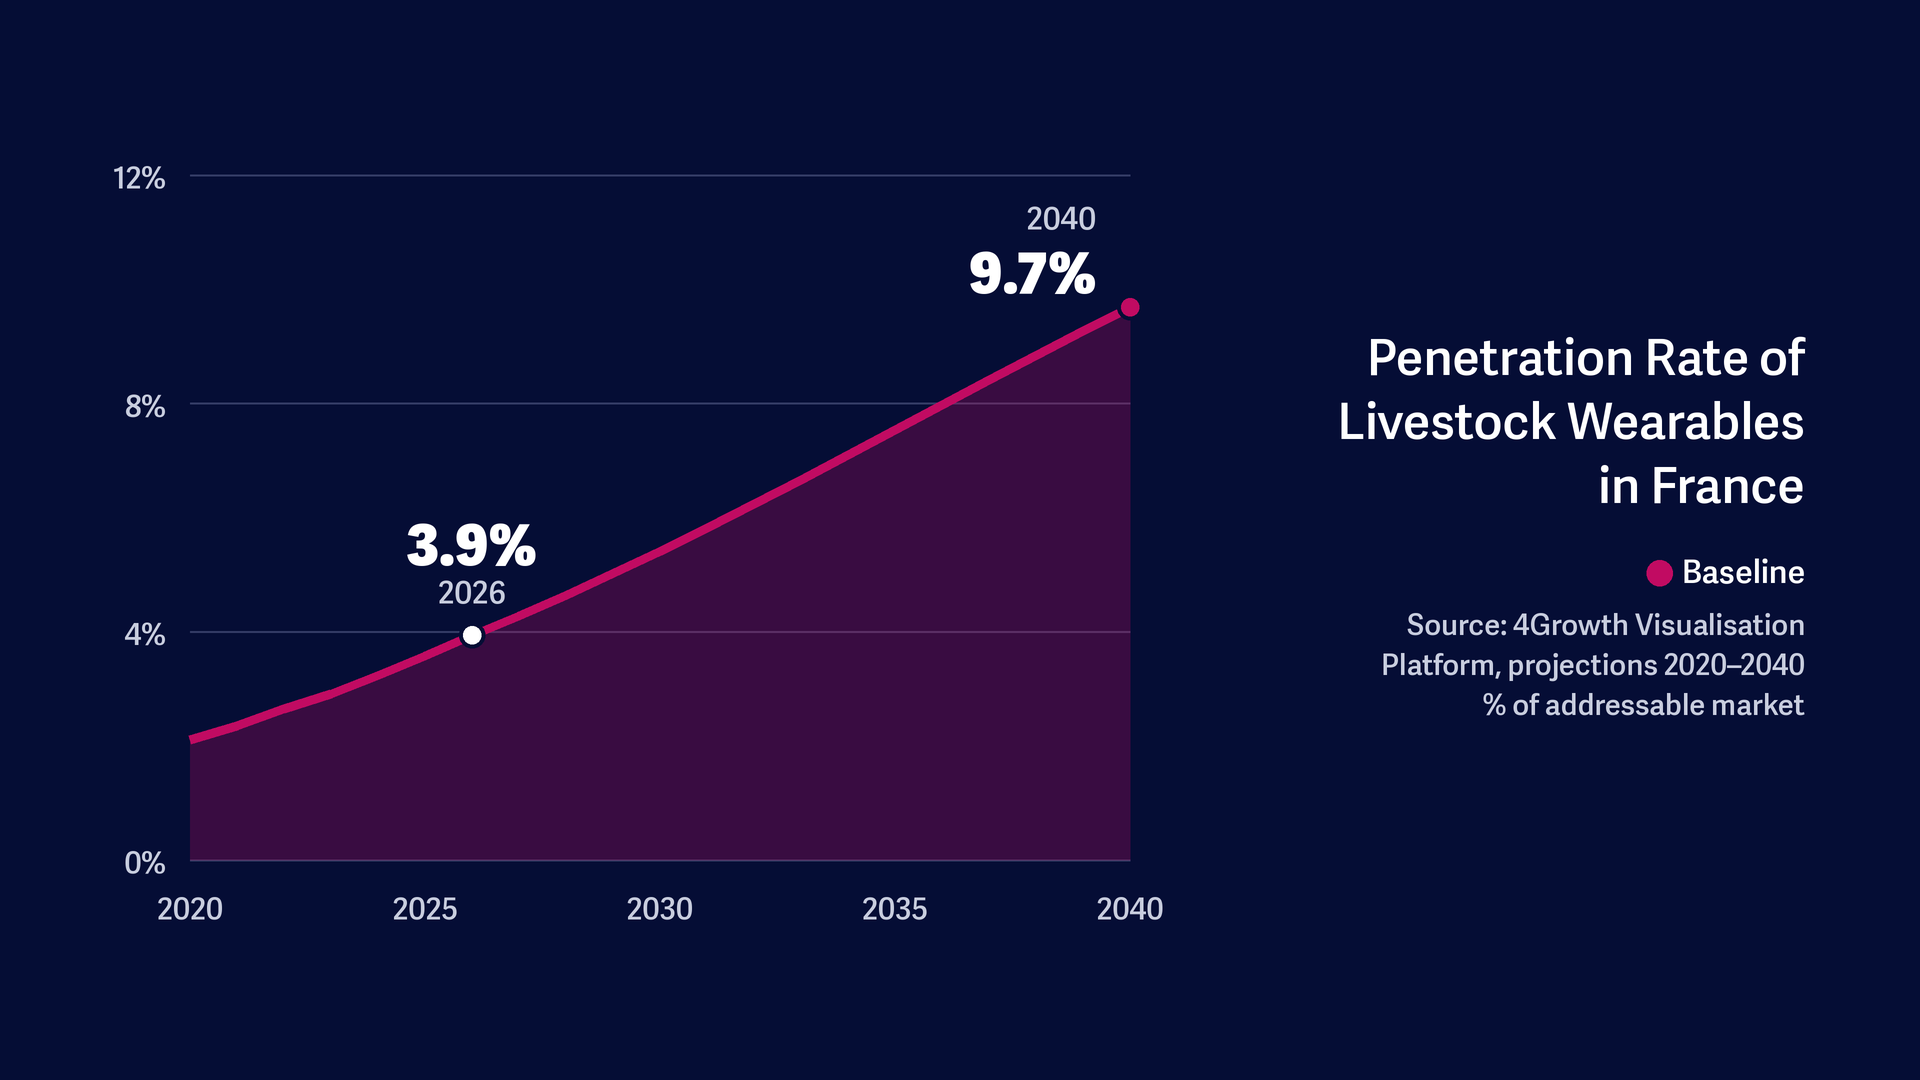
The addressable market, meaning the number of units that could realistically be used, is 15 to 16 million. It stays at a similar level in 2040. Penetration, the share of the addressable market already reached, is about 4%. That still leaves room to grow.
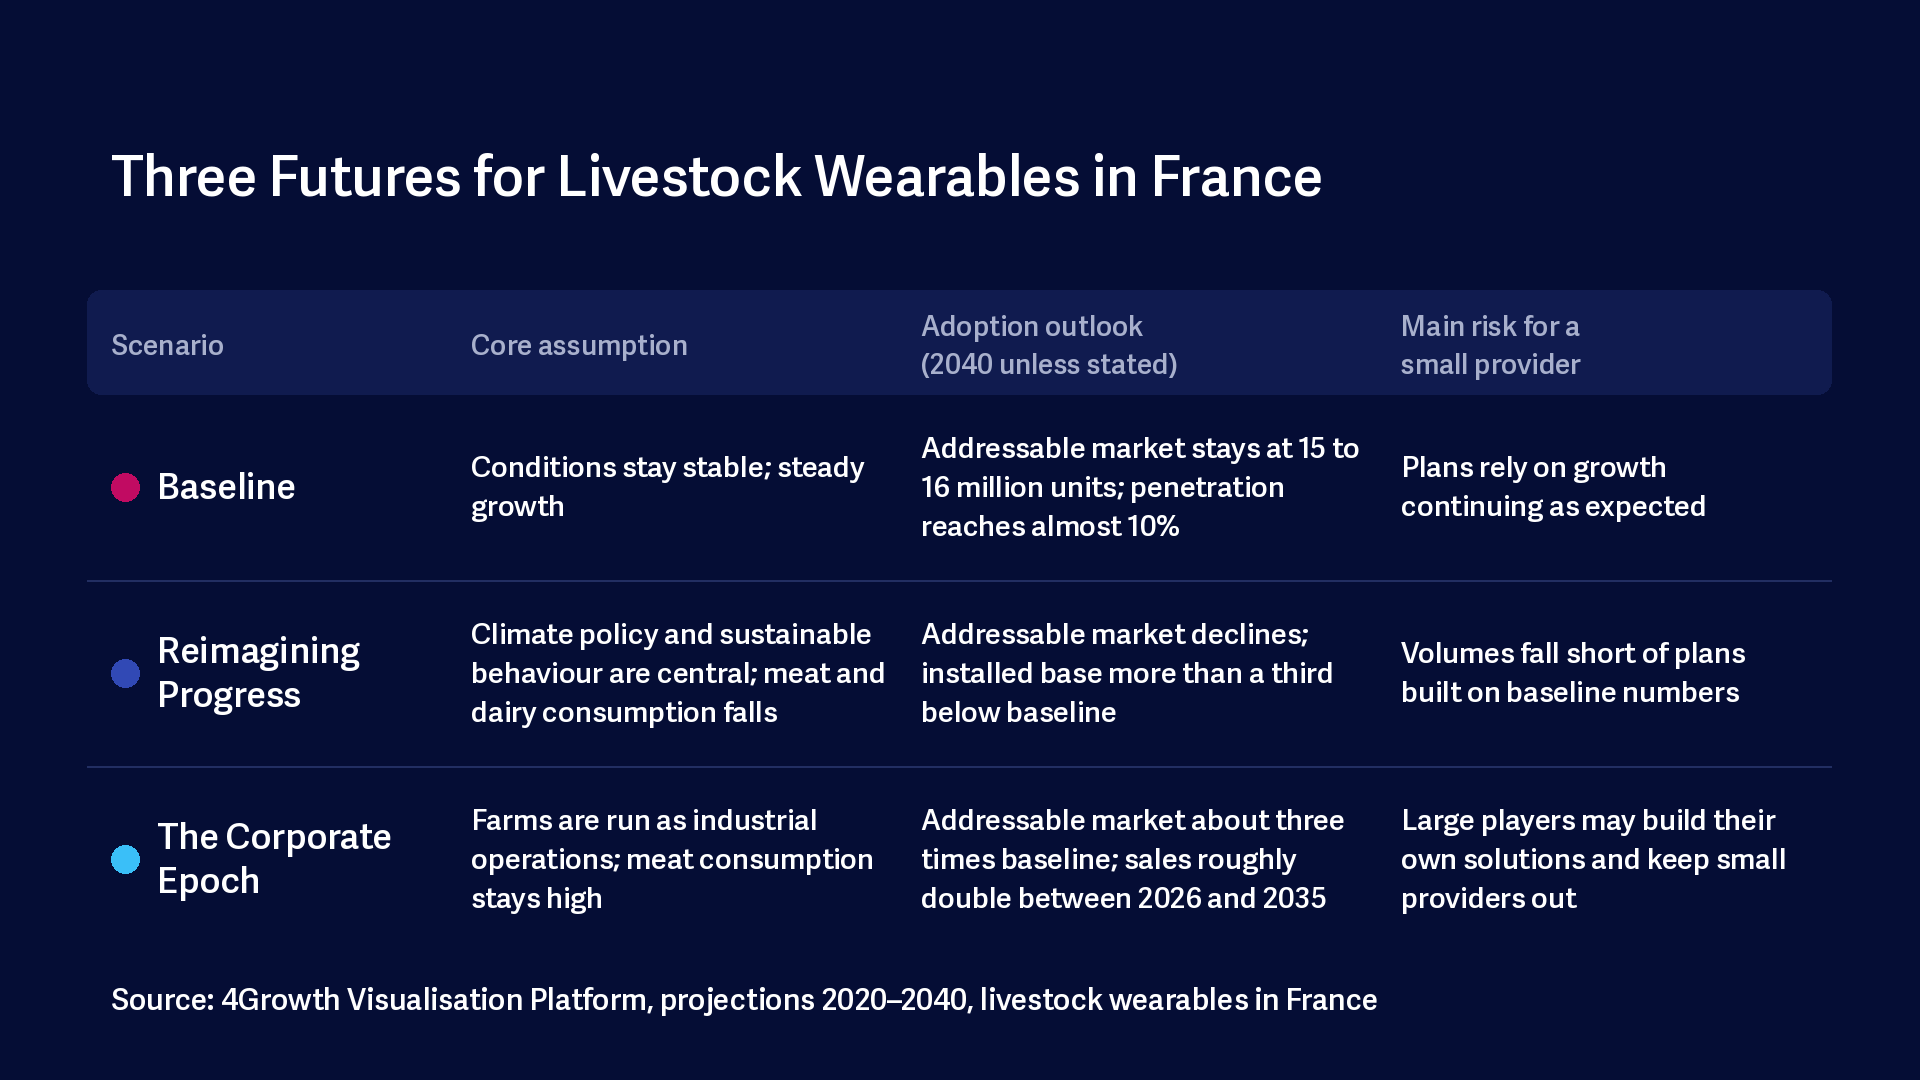
Not every farm needs wearables for its animals, though. In the Baseline scenario, penetration rises steadily to almost 10% by 2040, and unit sales grow as conditions stay stable.
The world is uncertain, so one forecast is not enough. A robust strategy works across several possible futures. An agile strategy can also adapt when conditions change.
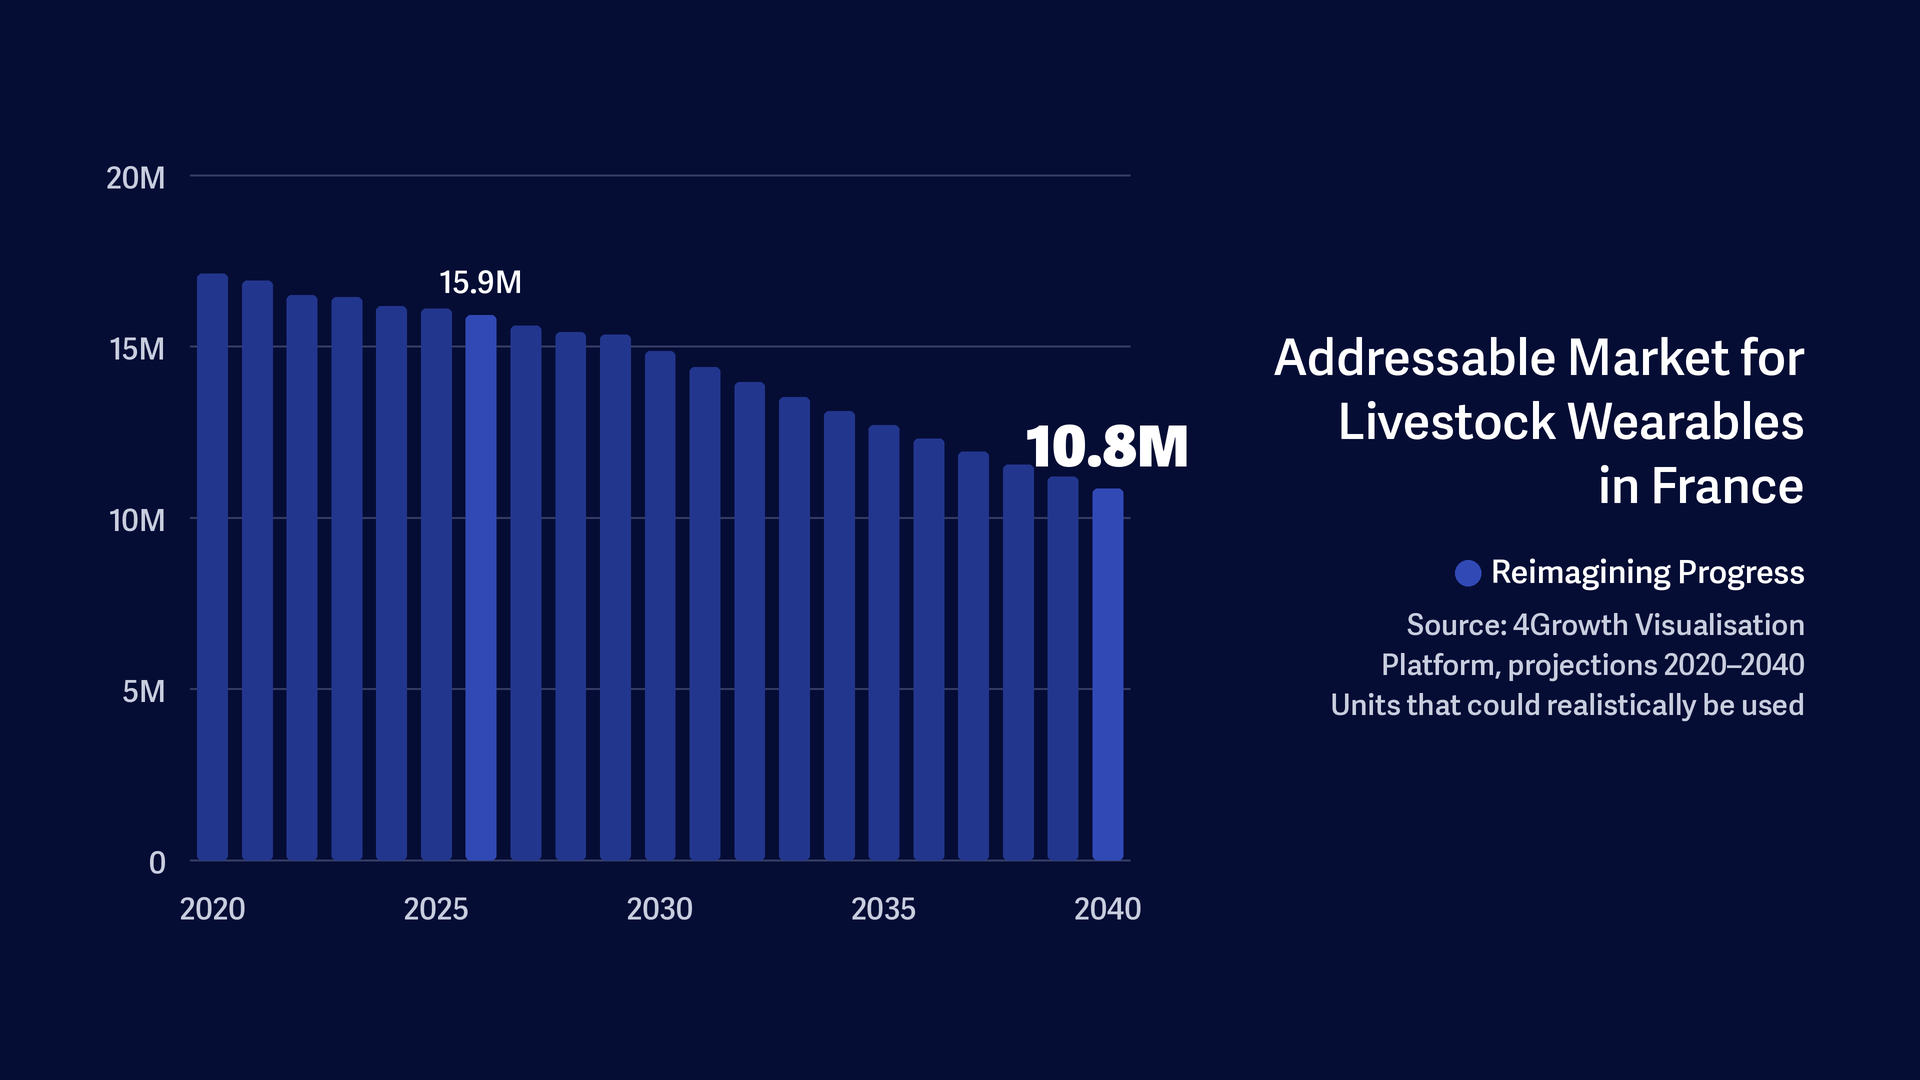
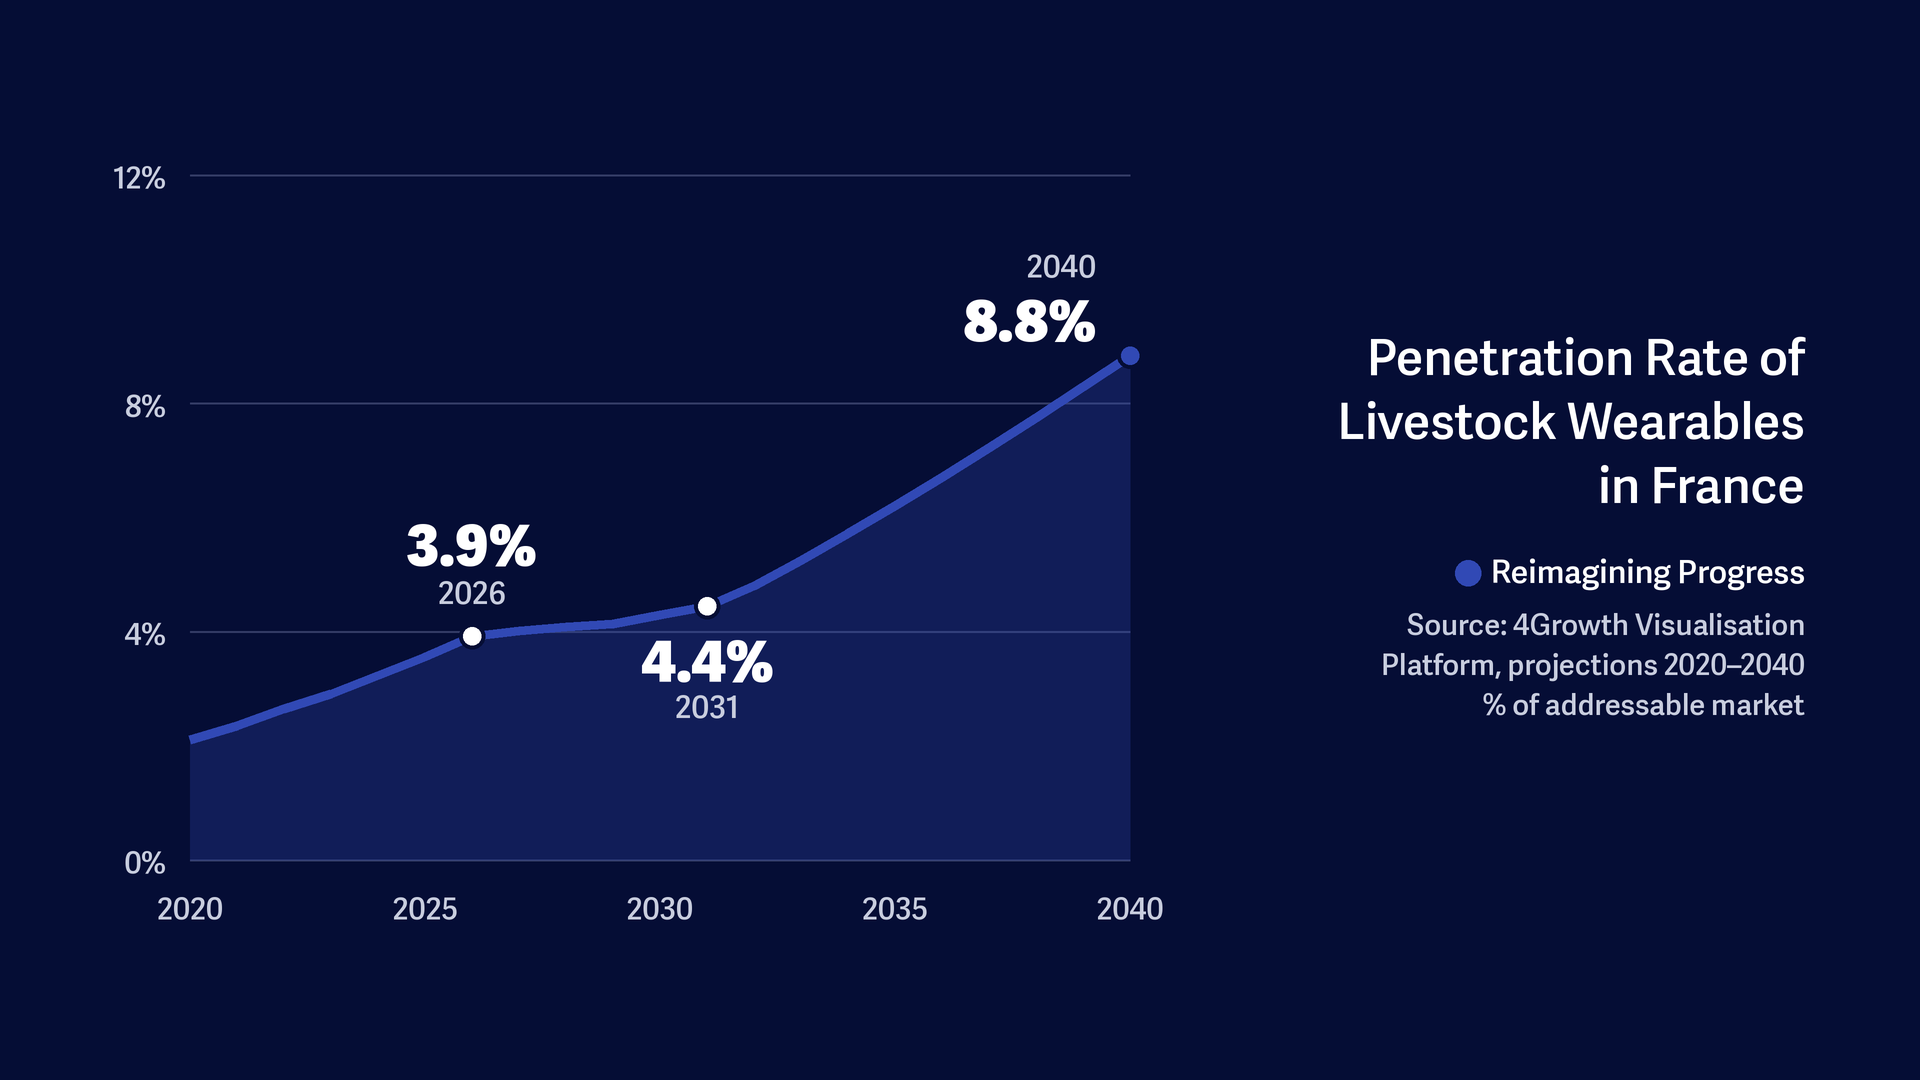
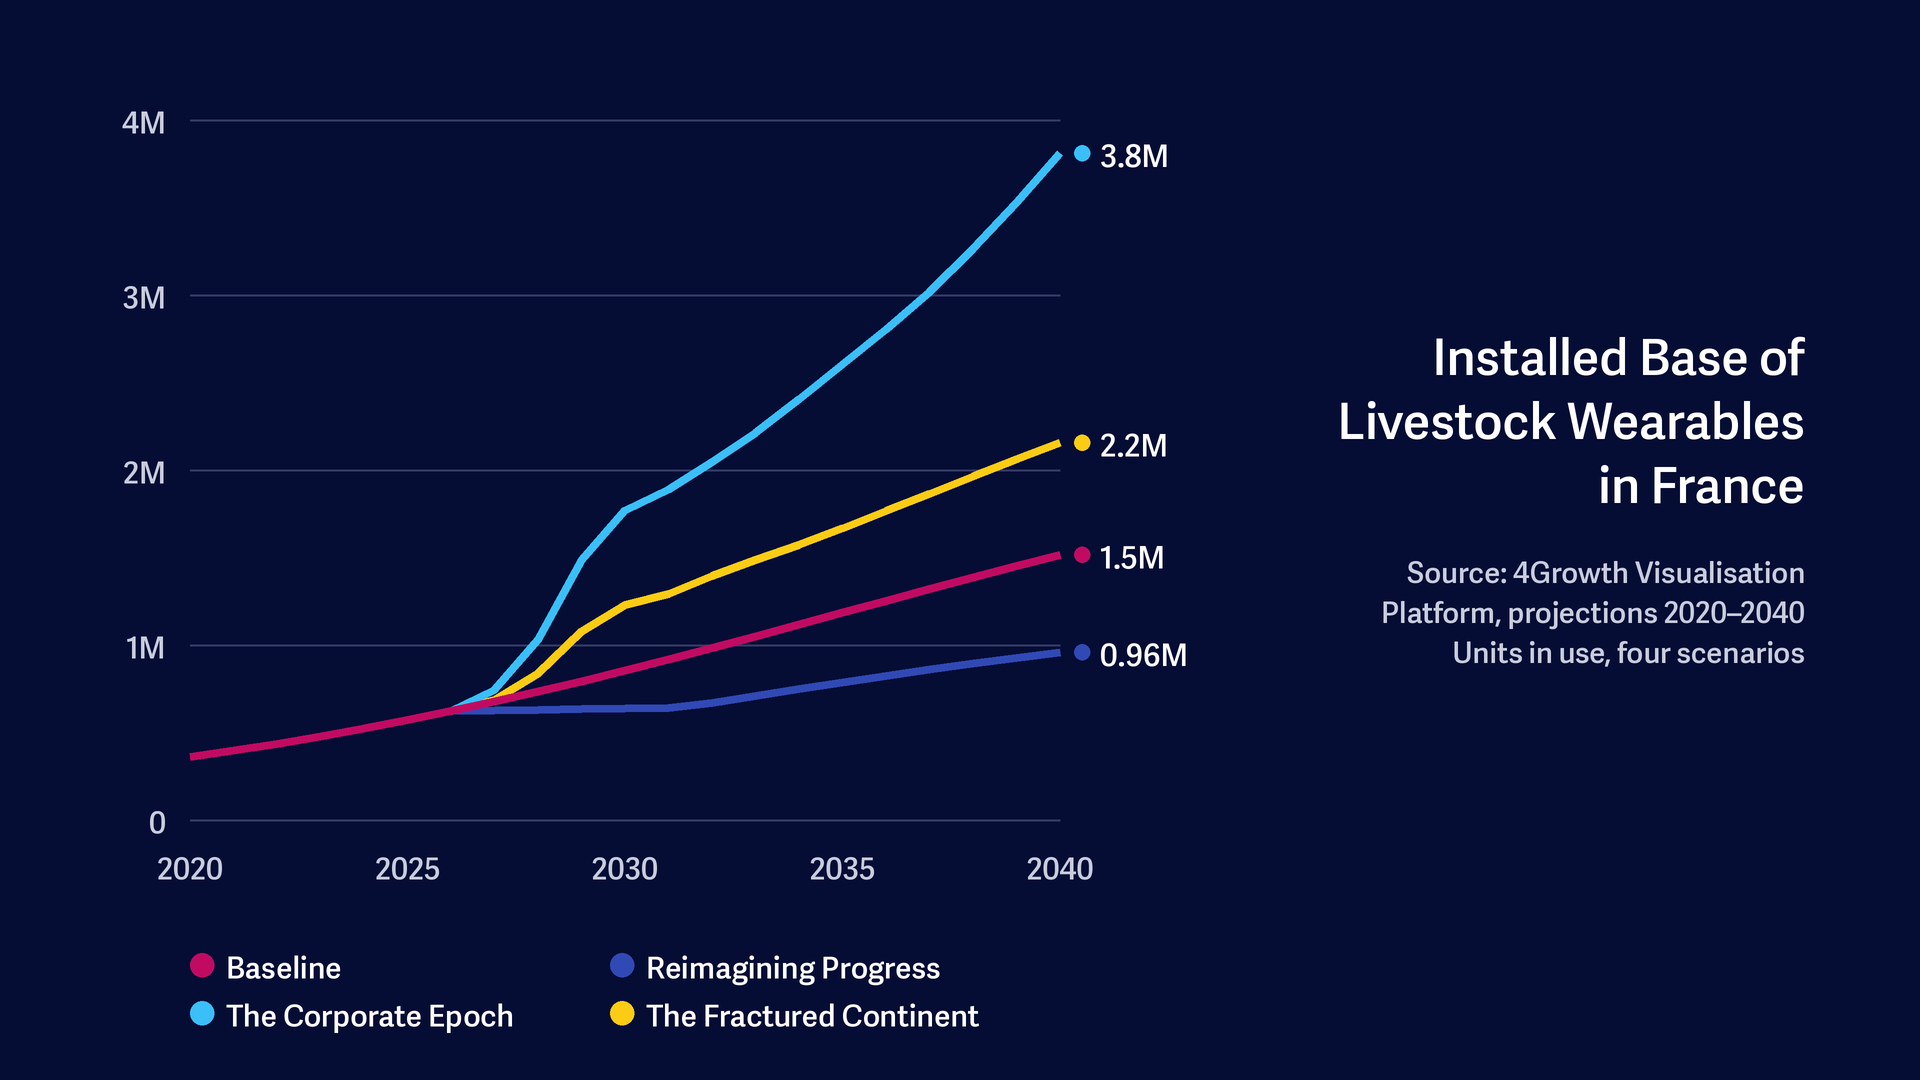
Consider Reimagining Progress. In this scenario, climate policy and sustainable behaviour are central, and meat and dairy consumption falls. Fewer animals are raised on farms, so the addressable market steadily declines. Penetration stays nearly flat until 2031, then rises again as digital tools help drive the green transition. Even so, the installed base in 2040 is more than a third smaller than in the Baseline scenario. For a wearables provider that planned around Baseline volumes, that is a significant gap.
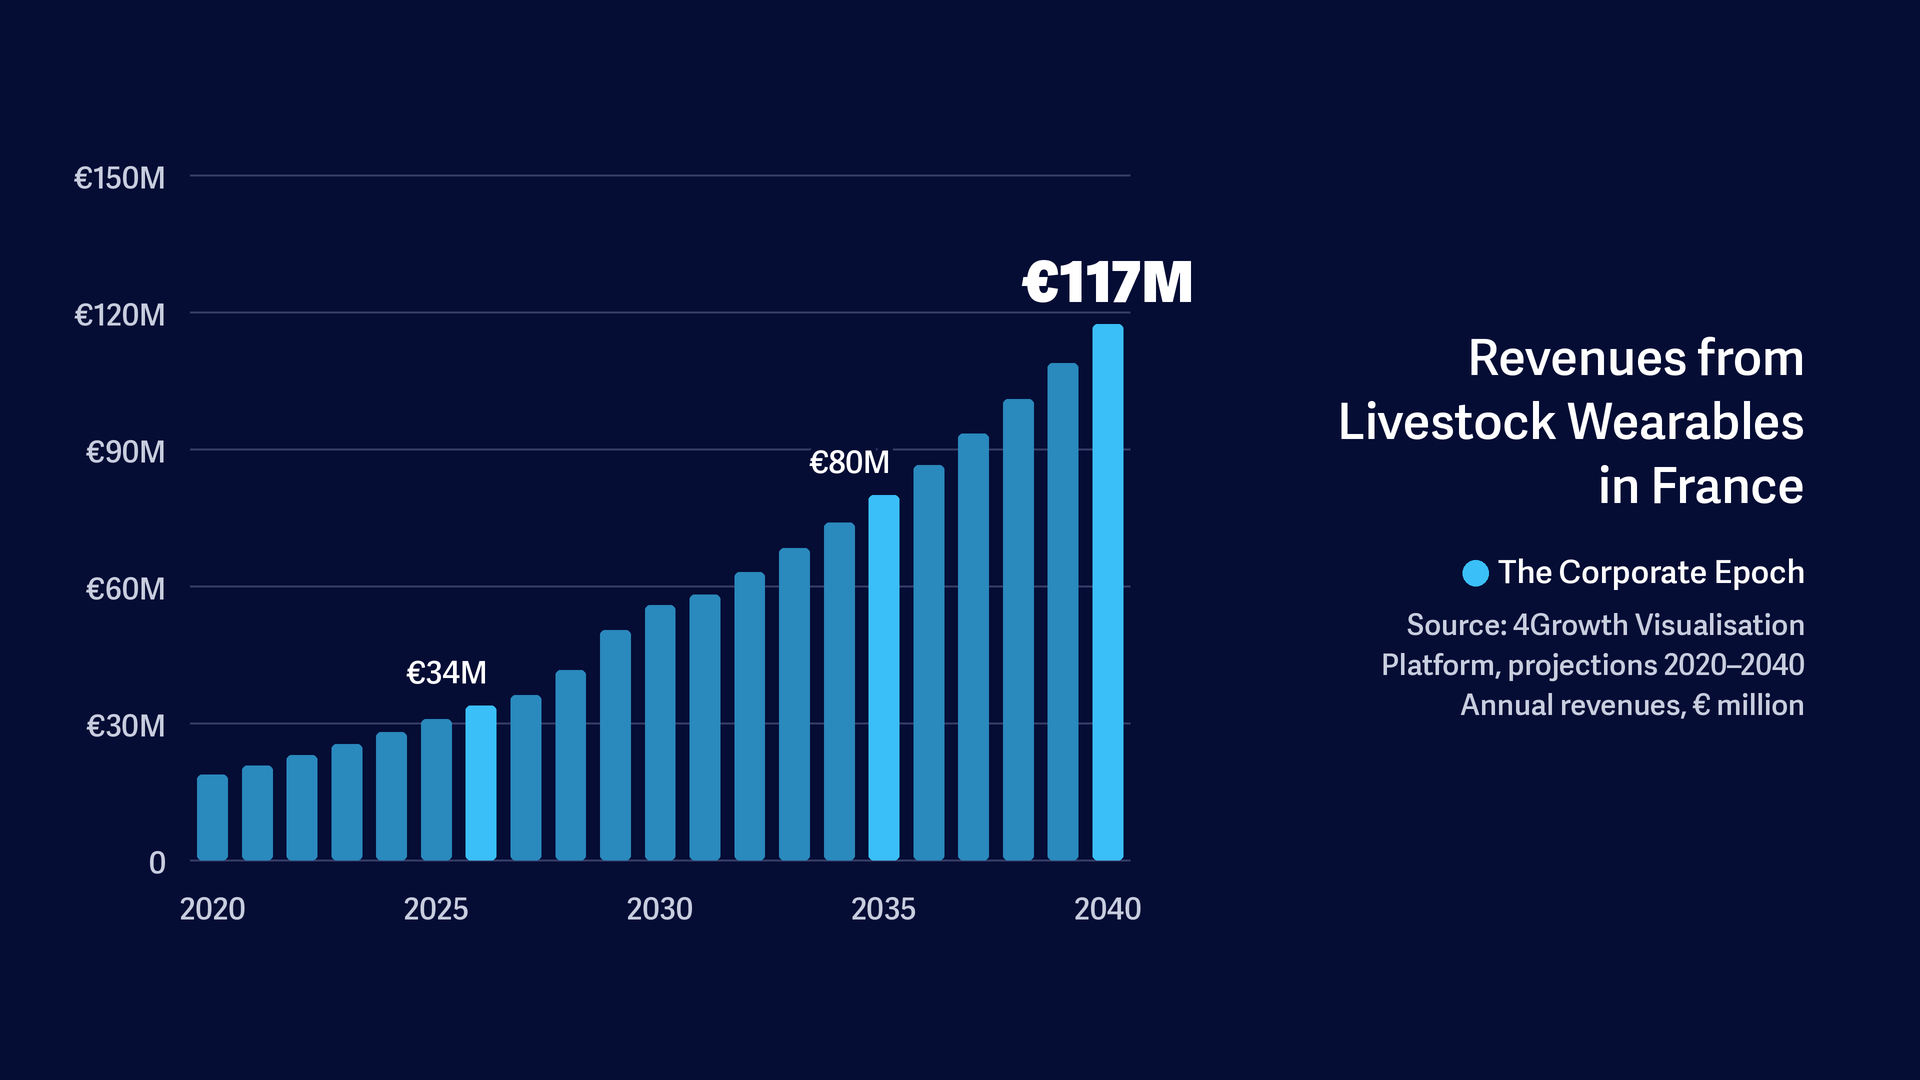
Now consider The Corporate Epoch scenario. Here, farms are professionalised and run like industrial operations in the Industry 4.0 style. Sensor data feeds centralised decisions made by large agribusiness players, and meat consumption stays high. The addressable market grows strongly and reaches three times the Baseline level in 2040. Wearable sales rise sharply and roughly double between 2026 and 2035.
This could look like the perfect market. But in the same world, agribusinesses and Big Tech companies are strong and often prefer to install their own solutions. Growth is real, but access may be difficult for a small technology provider. Market size alone does not show whether you can get in.
The table below summarises the scenarios discussed above.
The message is simple: stress-test your market assumptions against possible risks. This makes your strategy stronger, your investor case more credible, and your decisions more resilient.
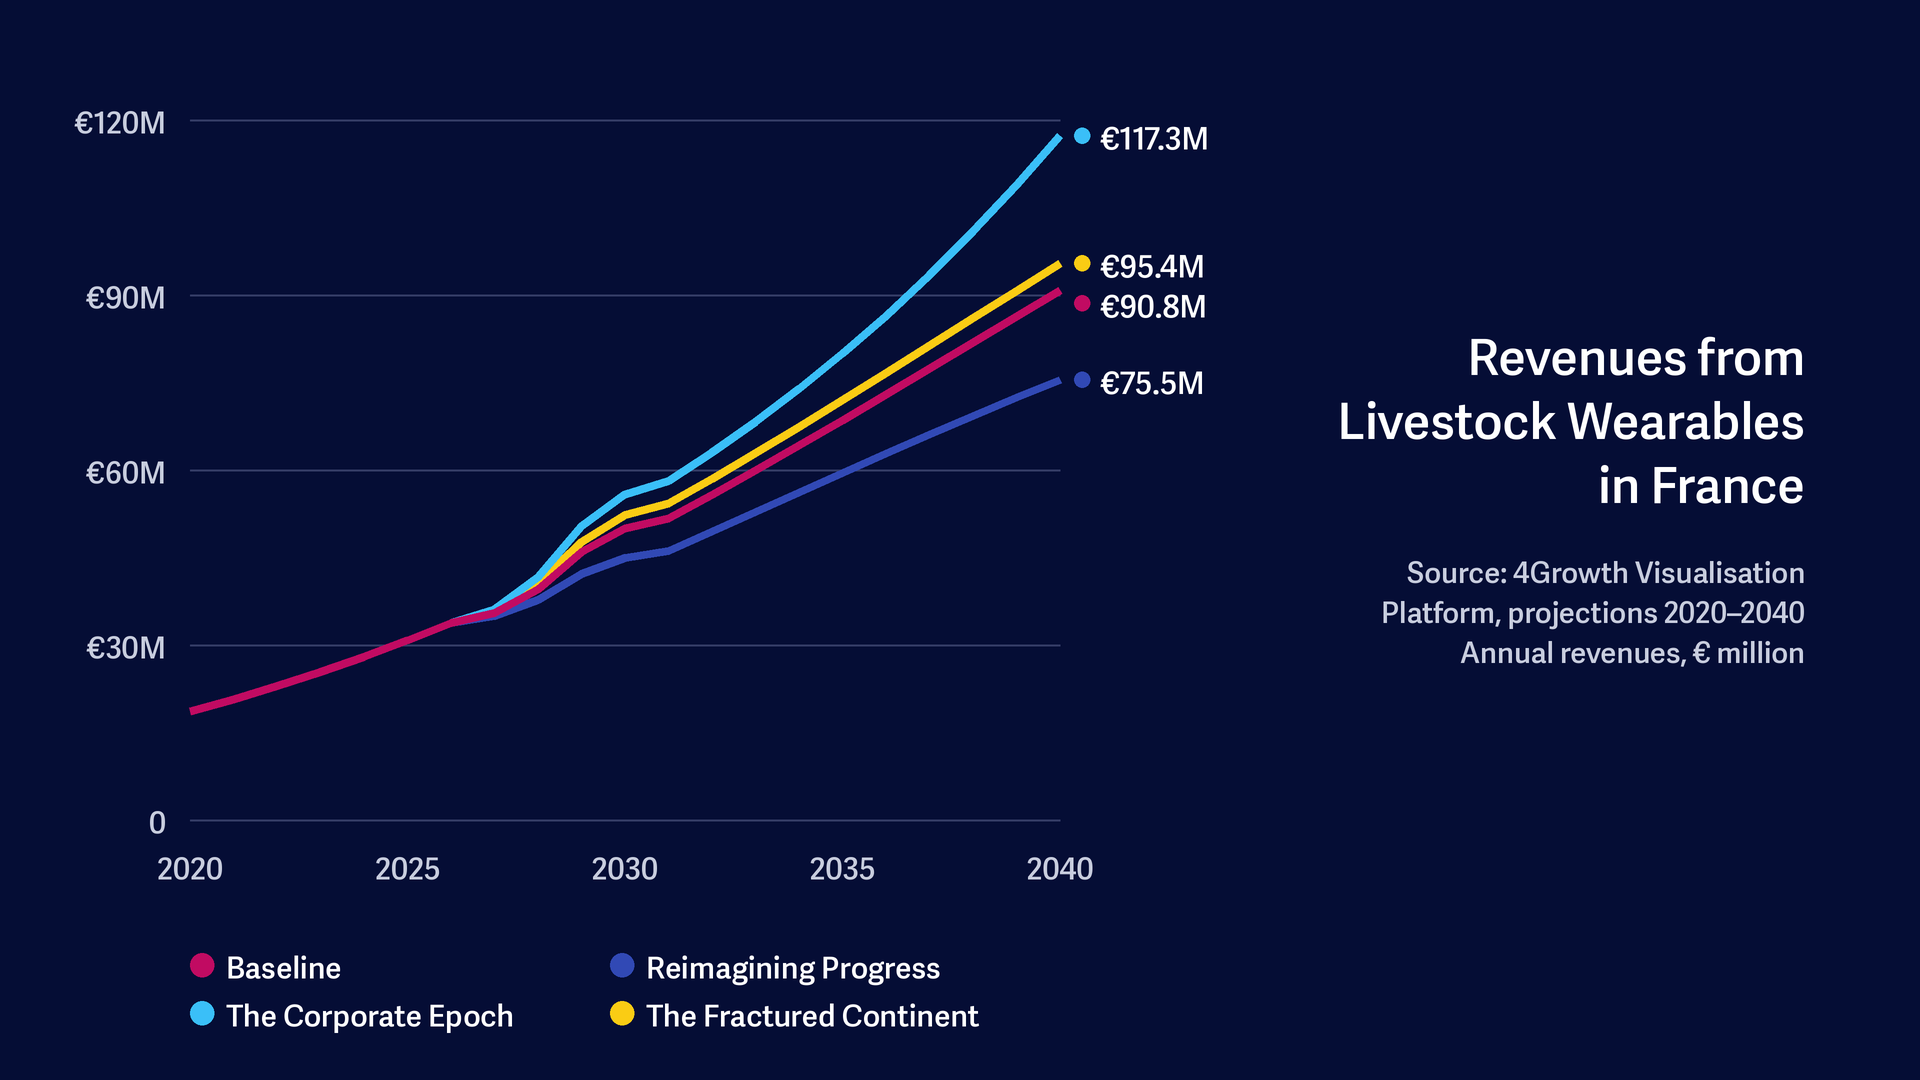
The 4Growth Visualisation Platform helps you do this. It provides the Baseline and alternative scenarios, so you can answer the “what if” questions and build risk analysis into your market plan. You can compare market size, sales, penetration rates, prices and revenues across all scenarios. To avoid overwhelming our story, we compared only the Baseline and two alternative scenarios. The Foresight module captures one more scenario “The Fractured Continent” which explores the question what if nations become more inward looking, interoperability is less of a challenge and only wealthy countries can afford to support digitalisation?
Revenues tell a slightly different story. By 2040, they range from about €75 million in Reimagining Progress to €117 million in The Corporate Epoch. The Baseline reaches €91 million. The gap between scenarios is much narrower than for the installed base.
Test how your business case holds up in each future: https://visualisation.4growth-project.eu/
Authored by Eckhard Störmer on behalf of Future Impacts. Edited by Evenflow.
—
How to reproduce each figure on the 4Growth Visualisation Platform
All figures: open visualisation.4growth-project.eu and select the Projections tab. Set Operation area to Agriculture. Under Filters, set Country to France and Technology to Livestock wearables, leaving “All technology types” and unit as they are. To export a chart’s data, use the “…” button on its card and download the CSV.
Figures 1 and 2 (Explore view): expand Scenarios and select Baseline. Figure 1 uses the Penetration card and Figure 2 the Shipments card.
Figures 3 and 4 (Explore view): under Scenarios, select Reimagining Progress. Figure 3 uses the Addressable Market card and Figure 4 the Penetration card.
Figures 5 and 6 (Explore view): under Scenarios, select The Corporate Epoch. Figure 5 uses the Revenues card and Figure 6 the Shipments card.
Figures 7 and 8 and Table 1 (Sandbox): switch from Explore to Sandbox. Under Settings, set Visualization to Line chart, Vertical to Installed base (Figure 7) or Revenues (Figure 8), and Color to Scenario, keeping the same filters. One export then holds all four scenarios. Table 1 uses the 2040 values of these two exports.
Tip: the scenario options only appear once an operation area is selected and the Scenarios section is expanded. The charts in this blog were built from exports made on 12 November 2026.
Sign up to stay informed of news, key outputs and upcoming events!